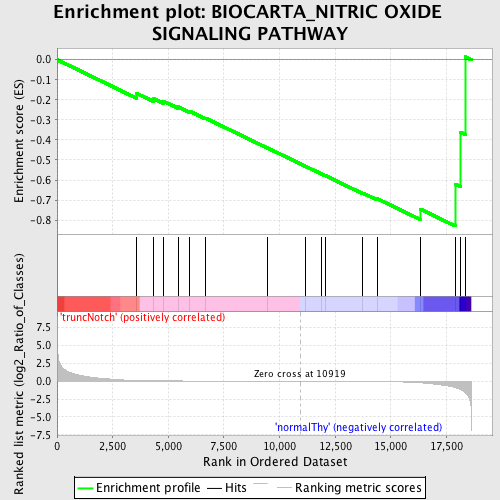
Profile of the Running ES Score & Positions of GeneSet Members on the Rank Ordered List
| Dataset | Set_03_truncNotch_versus_normalThy.phenotype_truncNotch_versus_normalThy.cls #truncNotch_versus_normalThy.phenotype_truncNotch_versus_normalThy.cls #truncNotch_versus_normalThy_repos |
| Phenotype | phenotype_truncNotch_versus_normalThy.cls#truncNotch_versus_normalThy_repos |
| Upregulated in class | normalThy |
| GeneSet | BIOCARTA_NITRIC OXIDE SIGNALING PATHWAY |
| Enrichment Score (ES) | -0.82900715 |
| Normalized Enrichment Score (NES) | -1.4951292 |
| Nominal p-value | 0.014989293 |
| FDR q-value | 0.37316507 |
| FWER p-Value | 0.997 |
| PROBE | DESCRIPTION (from dataset) | GENE SYMBOL | GENE_TITLE | RANK IN GENE LIST | RANK METRIC SCORE | RUNNING ES | CORE ENRICHMENT | |
|---|---|---|---|---|---|---|---|---|
| 1 | PRKCA | 6400551 | 3576 | 0.103 | -0.1680 | No | ||
| 2 | PRKAR2A | 2340136 | 4349 | 0.060 | -0.1953 | No | ||
| 3 | NOS1 | 5860129 | 4766 | 0.047 | -0.2065 | No | ||
| 4 | GRIN2C | 1500538 | 5434 | 0.033 | -0.2346 | No | ||
| 5 | PPP3CA | 4760332 6760092 | 5962 | 0.024 | -0.2572 | No | ||
| 6 | GRIN2A | 6550538 | 6663 | 0.017 | -0.2908 | No | ||
| 7 | GRIN1 | 3800014 7000609 | 9462 | 0.004 | -0.4403 | No | ||
| 8 | PRKAR1B | 6130411 | 11145 | -0.001 | -0.5305 | No | ||
| 9 | GRIN2B | 3800333 | 11884 | -0.003 | -0.5695 | No | ||
| 10 | PPP3CC | 2450139 | 12057 | -0.004 | -0.5779 | No | ||
| 11 | CAMK2B | 2760041 | 13743 | -0.015 | -0.6649 | No | ||
| 12 | GRIN2D | 6620372 | 14382 | -0.028 | -0.6927 | No | ||
| 13 | PRKAR2B | 3130593 5220577 | 16324 | -0.221 | -0.7449 | Yes | ||
| 14 | PPP3CB | 6020156 | 17890 | -0.883 | -0.6201 | Yes | ||
| 15 | PRKAR1A | 3450369 | 18122 | -1.148 | -0.3612 | Yes | ||
| 16 | PRKACB | 4210170 | 18351 | -1.640 | 0.0142 | Yes |

